By default, the Plot function draws the graph for all visible bars. In some situations however, we may want to draw some selected bars, leaving remaining chart space unaffected.
To achieve that – we simply assign Null value for the bars that we want to skip. Our graph will just be drawn for the non-null bars.
This simple example draws candlesticks only on Mondays and leaves empty all the other days.
IsMonday = DayOfWeek() == 1;
// assign Close for Mondays, otherwise assign Null
Data = IIf( IsMonday, Close, Null );
// plot the data
Plot( Data, "Chart of Mondays", colorDefault, styleCandle );
The following example shows how to restrict the visibility to last N bars. The code defines a custom function, which can be called later on for the arrays we want to show only partially.
// custom function definition
function LastNBars( array, bars )
{
    bi = BarIndex();
    lvbi = LastValue( bi );

    // use Null value for bars other than last N
    return IIf( bi > lvbi - bars, array, Null );
}

// price plot
Plot( Close, "Close", colorDefault, styleBar );

// MA-50 restricted to last 10-bars only
line = MA( Close, 50 );
Plot( LastNBars( line, 10 ), "last 10 bars", colorRed );

// shaded area
Plot( LastNbars( True, 10 ), "", colorYellow, styleArea|styleOwnScale|styleNoLabel, 0, 1, 0, -1 );
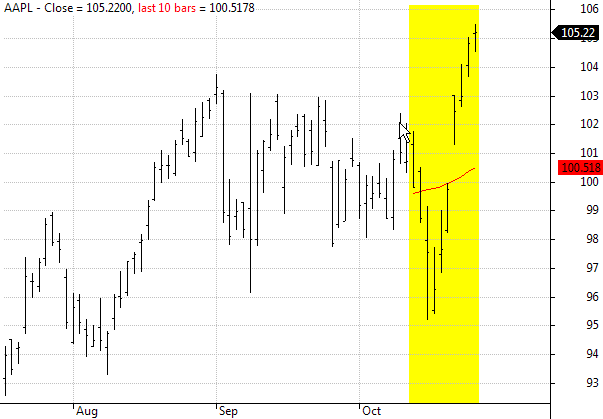
In the above chart both Moving average (red line) and yellow shading area have been restricted to last 10-bars only.
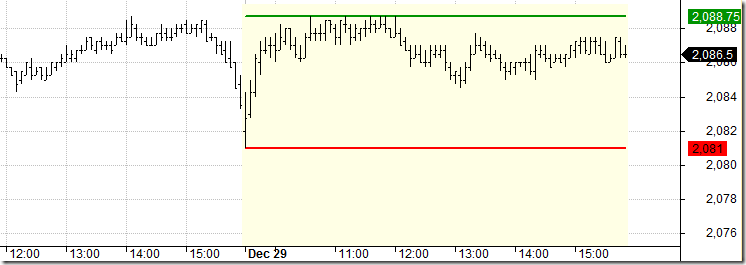
In a similar way we can restrict the visibility to most recent day only in intraday chart:
// custom function definition
function ShowLastDay( array )
{
    dn = datenum();
    lastDay = dn == LastValue( dn );

    return IIf( lastDay, array, Null );
}

// price plot
Plot( Close, "Close", colorDefault, styleBar );

// daily high / low on last day only
dailyH = TimeFrameGetPrice("H", inDaily );
dailyL = TimeFrameGetPrice("L", inDaily );
Plot( ShowLastDay( dailyH ), "dailyH", colorGreen, styleThick  );
Plot( ShowLastDay( dailyL ), "dailyL", colorRed, styleThick  );

// shaded area
colorPaleYellow = ColorBlend(colorWhite, colorYellow, 0.1);
style = styleArea | styleOwnScale | styleNoLabel;
Plot( ShowLastDay( 1 ), "", colorPaleYellow, style, 0, 1, 0, -1 );
Other practical implementations of such technique is presented in these formulas:
http://www.amibroker.com/kb/2007/03/24/how-to-plot-a-trailing-stop-in-the-price-chart/
http://www.amibroker.com/kb/2014/10/10/how-to-draw-regression-channel-programatically/